The Mobicents suite is growing everyday, from the early days of the initial JAIN SLEE container project, a lot of new fronts have been going on, such as SIP Servlets, Diameter Stack, Media Server, SS7 Stack, Restcomm, etc.
With such a vaste suite of projects, the need for common management and monitoring tools is a major concern we have been facing, as each project having it's own set of tools is not a optimal solution. At least a common framework/interface is desired.
JMX is a standard for monitoring and managing JVMs, but it's connector uses RMI, which is not the sexiest protocol these days. In that sense, we have searched for a JMX <=> HTTP bridge to use a REST-like protocol as a frontend to the JMX server. This brought us to Jolokia. With such bridge, we can easily extend our choices of management frameworks outside Java. Plus, it brings many other goodies, such as being firewall friendly (HTTP is allowed anywhere), security (filter what is accessible), support for bulk requests, etc.
Installing Jolokia
Jolokia is very simple to install in the JBoss AS container:- Download Jolokia from here. Select the binary package.
- Extract the zip file.
- Copy the jolokia.war from the agents sub-directory to your JBoss AS deploy directory.
- If the JBoss AS is not running already, start it.
You should now be able to issue HTTP requests to Jolokia agent. Using curl (or pointing your browser to the URL), you can do:
$ curl http://localhost:8080/jolokia/read/java.lang:type=Memory/HeapMemoryUsage/used

{"timestamp":1355453720,"status":200,"request":{"mbean":"java.lang:type=Memory","path":"used",
"attribute":"HeapMemoryUsage","type":"read"},"value":310667560}
This is how we read a value, returned in a JSON format, using Jolokia REST API. The format used is the following: <base-url>/read/<mbean name>/<attribute name>/<inner path>. You can learn more reading the Jolokia Reference Manual.
So, now that we have this working, lets make some good use of it. Graphs are the best way to show this data over time. Looking for a good JavaScript graphs library, there are several options such as Google Chart Tools, HighCharts, jqPlot, YUI Charts, etc. For this demo we will be using HighCharts. It is not completely free, but it is a very good and feature rich chart library, plus there's this great article by Tomasz Nurkiewicz to help us getting started.
So, let's start to build our dashboard. Create an HTML file in your favorite editor and, here we go:
<html>
 <body>
  <div id="chart" />

  <script src="https://ajax.googleapis.com/ajax/libs/jquery/1.8.3/jquery.js"></script>
  <script src="https://ajax.googleapis.com/ajax/libs/jqueryui/1.9.2/jquery-ui.js"></script>
  <script src="http://jolokia.org/dist/1.0.6/js/jolokia.js"></script>
  <script src="http://jolokia.org/dist/1.0.6/js/jolokia-simple.js"></script>
  <script src="http://code.highcharts.com/highcharts.src.js"></script>

  <script id="source" language="javascript" type="text/javascript">
   $(document).ready(function() {
    var jolokia = new Jolokia("http://localhost:8080/jolokia");

    var chart = new Highcharts.Chart({
     chart: {
      renderTo: 'chart',
      defaultSeriesType: 'spline',
      events: {
       load: function() {
        var series = this.series[0];
        setInterval(function() {
         var x = (new Date()).getTime();
         var memoryUsed = jolokia.getAttribute("java.lang:type=Memory", "HeapMemoryUsage", "used");
         series.addPoint({
          x: new Date().getTime(),
          y: parseInt(memoryUsed)
         }, true, series.data.length >= 50);
        }, 1000);
       }
      }
     },
     title: {
      text: 'HeapMemoryUsage'
     },
     xAxis: {
      type: 'datetime'
     },
     yAxis: {
      title: { text: 'HeapMemoryUsage' }
     },
     series: [{
      data: [],
      name: 'Used Memory'
     }]
    });
   });
  </script>
 </body>
</html>
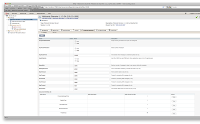
These 50 lines of HTML/JavaScript code already produce a very nice chart:

This is as easy as it gets! We may now add a lot of other extras, make it more generic to handle several charts, several data sources per chart, make use of jQuery UI Sortable to make a portlet-like dashboard, where it is possible to group and arrange those charts as desired, etc. Ready? Let's go!
<html>
 <head>
  <link rel="stylesheet" type="text/css" href="http://ajax.googleapis.com/ajax/libs/jqueryui/1.9.2/themes/black-tie/jquery-ui.css"/>
  <style>
   .column { width: 400px; float: left; padding-bottom: 10px; }
   .portlet { margin: 0 1em 1em 0; }
   .portlet-header { margin: 0.3em; padding-bottom: 4px; padding-left: 0.2em; }
   .portlet-header .ui-icon { float: right; }
   .portlet-content { padding: 0.4em; }
   .ui-sortable-placeholder { border: 1px dotted black; visibility: visible !important; height: 238px !important; }
   .ui-sortable-placeholder * { visibility: hidden; }
  </style>
 </head>

 <body style="background-color: #EEE; font-family: Verdana; font-size: small;">
  <!-- The template to be used for new portlets -->
  <div style="display: none;">
   <div class="portlet ui-widget-content ui-helper-clearfix ui-corner-all" id="portlet-template" style="">
    <div class="portlet-header ui-widget-header ui-corner-all">
     <span class='ui-icon ui-icon-minusthick'></span>
     <span class="title"> </span>
    </div>
    <div class="portlet-content"></div>
   </div>
  </div>

  <div><h2 style="text-align: center;">.:[ MOBICENTS DASHBOARD ]:.</h2></div>
  <hr />
  <div id="charts" class="column" /></div>

  <script src="https://ajax.googleapis.com/ajax/libs/jquery/1.8.3/jquery.js"></script>
  <script src="https://ajax.googleapis.com/ajax/libs/jqueryui/1.9.2/jquery-ui.js"></script>
  <script src="http://jolokia.org/dist/1.0.6/js/jolokia.js"></script>
  <script src="http://jolokia.org/dist/1.0.6/js/jolokia-simple.js"></script>
  <script src="http://code.highcharts.com/highcharts.src.js"></script>

  <script id="source" language="javascript" type="text/javascript">
  $(document).ready(function() {
   jolokia = new Jolokia({url: "http://localhost:8080/jolokia", fetchInterval: 1000});

   var factory = new JmxChartsFactory();
    factory.create([
     {
      type: 'read',
      name: 'org.mobicents.slee:name=EventRouterStatistics',
      attribute: 'AverageEventRoutingTime'
     }
    ]);
    factory.create([
     {
      type: 'read',
      name: 'org.mobicents.slee:name=EventRouterStatistics',
      attribute: 'ActivitiesMapped'
     }
    ]);
    executors = []
    numExecutors = jolokia.getAttribute("org.mobicents.slee:name=EventRouterConfiguration","EventRouterThreads");
    for (var i = 0; i < numExecutors; i++) {
     executors[i] = {
      type: 'exec',
      name: 'org.mobicents.slee:name=EventRouterStatistics',
      operation: 'getAverageEventRoutingTime(int)',
      args: [i]
     }
    }
    factory.create(executors);
    factory.create([
     {
      type: 'read',
      name: 'java.lang:type=Memory',
      attribute: 'HeapMemoryUsage',
      path: 'committed'
     },
     {
      type: 'read',
      name: 'java.lang:type=Memory',
      attribute: 'HeapMemoryUsage',
      path: 'used'
     }
    ]);
    factory.create(
     {
      type: 'read',
      name: 'java.lang:type=OperatingSystem',
      attribute: 'SystemLoadAverage'
     }
    );
    factory.create(
     {
      type:  'read',
      name:  'java.lang:type=Threading',
      attribute: 'ThreadCount'
     }
    );
   });

   function JmxChartsFactory(keepHistorySec, pollInterval, columnsCount) {
    var series = [];
    var monitoredMbeans = [];
    var chartsCount = 0;

    // if not given a value for number of columns, use what fits.
    columnsCount = columnsCount || Math.floor($(window).width()/$(".column").width());
    // poll interval, defaults to 1000ms
    pollInterval = pollInterval || 1000;
    // how many data points to show in the graphs, defaults to 30
    var keepPoints = (keepHistorySec || 30) / (pollInterval / 1000);

    setupPortletsContainer(columnsCount);

    setInterval(function() {
     pollAndUpdateCharts();
    }, pollInterval);

    this.create = function(mbeans) {
     mbeans = $.makeArray(mbeans);
     series = series.concat(createChart(mbeans).series);
     monitoredMbeans = monitoredMbeans.concat(mbeans);
    };

    function pollAndUpdateCharts() {
     var requests = prepareBatchRequest();
     var responses = jolokia.request(requests);
     updateCharts(responses);
    }

    function createNewPortlet(name) {
     return $('#portlet-template')
       .clone(true)
       .appendTo($('.column')[chartsCount++ % columnsCount])
       .removeAttr('id')
       .find('.title').text((name.length > 50 ? '...' : '') + name.substring(name.length - 50, name.length)).end()
       .find('.portlet-content')[0];
    }

    function setupPortletsContainer() {
     var column = $('.column');
     for(var i = 1; i < columnsCount; ++i){
      column.clone().appendTo(column.parent());
     }
     $(".column").sortable({
      connectWith: ".column"
     });

     $(".portlet-header .ui-icon").click(function() {
      $(this).toggleClass("ui-icon-minusthick").toggleClass("ui-icon-plusthick");
      $(this).parents(".portlet:first").find(".portlet-content").toggle();
     });
     $(".column").disableSelection();
    }

    function prepareBatchRequest() {
     return $.map(monitoredMbeans, function(mbean) {
      switch(mbean.type) {
       case 'read':
        return {
         type: mbean.type,
         opts: mbean.args,
         mbean: mbean.name,
         attribute: mbean.attribute,
         path: mbean.path
        };
        break;
       case 'exec':
        return {
         type: mbean.type,
         arguments: mbean.args,
         mbean: mbean.name,
         operation: mbean.operation,
         path: mbean.path
        };
        break;
      }
     });
    }

    function updateCharts(responses) {
     var curChart = 0;
     $.each(responses, function() {
      var point = {
       x: this.timestamp * 1000,
       y: parseFloat(this.value)
      };
      var curSeries = series[curChart++];
      curSeries.addPoint(point, true, curSeries.data.length >= keepPoints);
     });
    }

    function createChart(mbeans) {
     return new Highcharts.Chart({
      chart: {
       renderTo: createNewPortlet(mbeans[0].name),
       height: 200,
       defaultSeriesType: 'spline',
      },
      title: { text: null },
      xAxis: { type: 'datetime' },
      yAxis: { title: { text: mbeans[0].attribute || mbeans[0].operation } },
      legend: {
       enabled: true,
       borderWidth: 0
      },
      credits: {enabled: false},
      series: $.map(mbeans, function(mbean) {
       return {
        data: [],
        name: mbean.path || mbean.attribute || mbean.args
       }
      })
     })
    }
   }
  </script>
 </body>
</html>
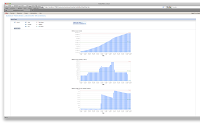
A bit more of code than previously, but with this we added 6 different graphs, some with more than one data series, we added portlet behavior... in my opinion, it is still quite simple for the output we get of it:

Is it cool or what? And all of this in a single static html file. Personally, I love it.
And this is the way we are heading with Mobicents Monitoring and Management... adding some extras such as thresholds with some kind of alarms/notifications, more customization like easily adding/removing charts at runtime through web interface, add some persistence to remember history and preferences, and many more to make this a solid tool to keep your Mobicents suite under control!


